My research is interdisciplinary, encompassing social media/computational social science, web/data science, web archiving, and (local) news.
BLOC (Behavioral Language for Online Classification)
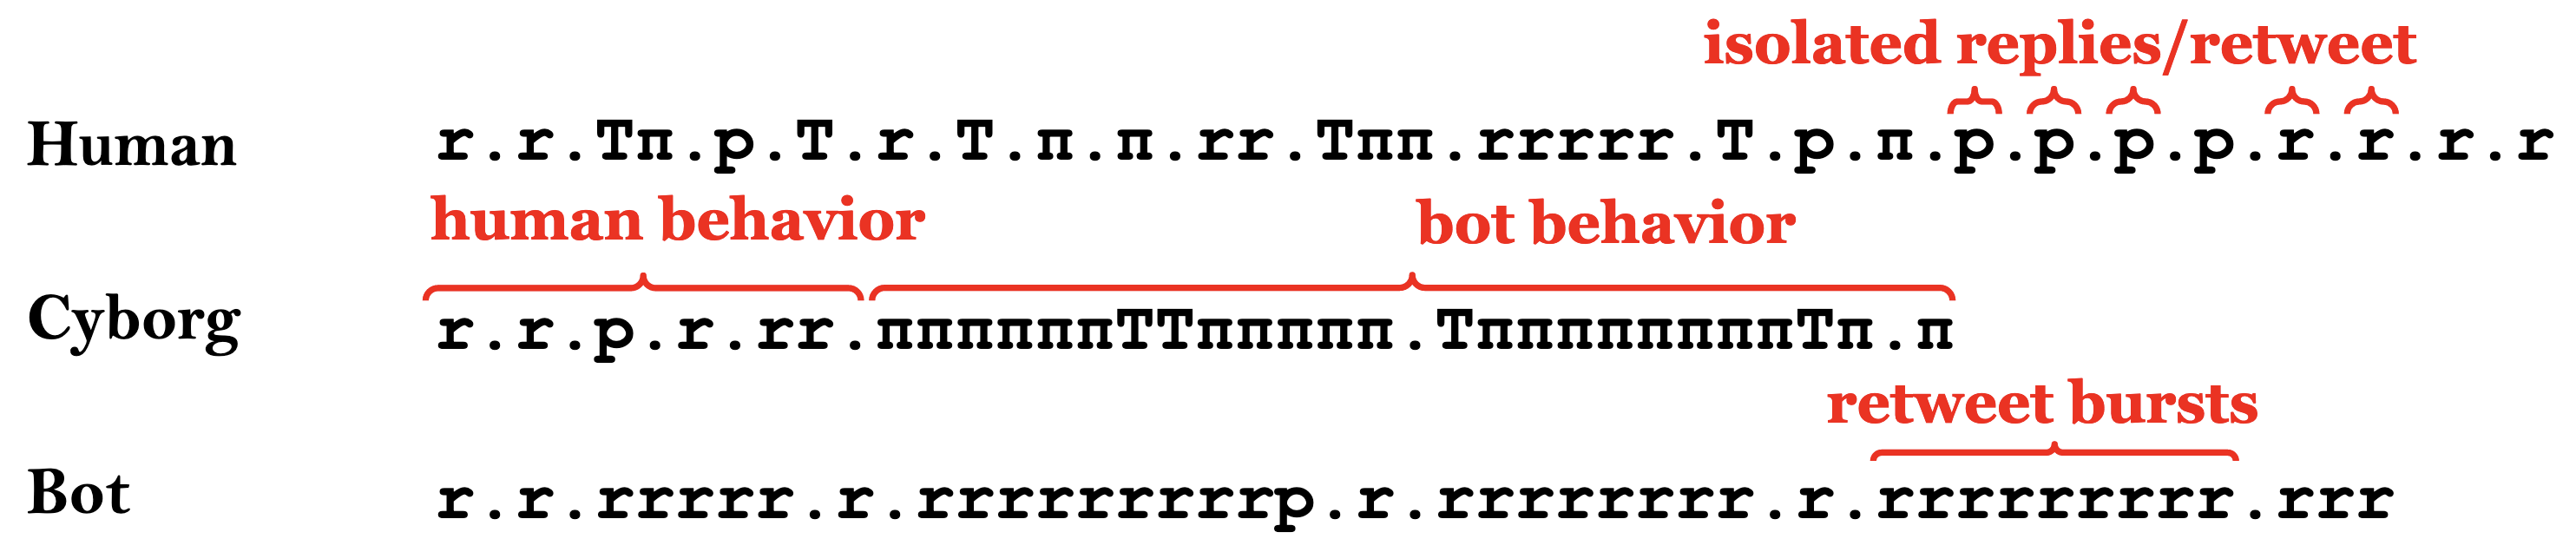
BLOC is a language for representing the online behaviors of social media accounts irrespective of class (human or cyborg or bot) or intent (malicious or benign). BLOC words consist of letters drawn from various alphabets (e.g., actions, pause, & content alphabets). The language is highly flexible, and can be applied to model a broad spectrum of legitimate and suspicious online behaviors.
Illustrations of BLOC action strings for a human, a cyborg, and a bot Twitter account illustrating some behavioral differences across these individuals. If strings are tokenized using pauses, the human account has the shortest words (average length 1.35 vs. 3.88 for the cyborg and 4.0 for the bot) and is dominated by isolated retweets and replies. The cyborg account — which we created to post threads of news updates — exhibits both human (isolated posts) and bot behavior (thread bursts). The bot account mainly generates retweet bursts.
BLOC has been effectively applied for explaining online behaviors, bot and coordination detection, and detecting accounts — controlled by various nation states — engaged in information operations.
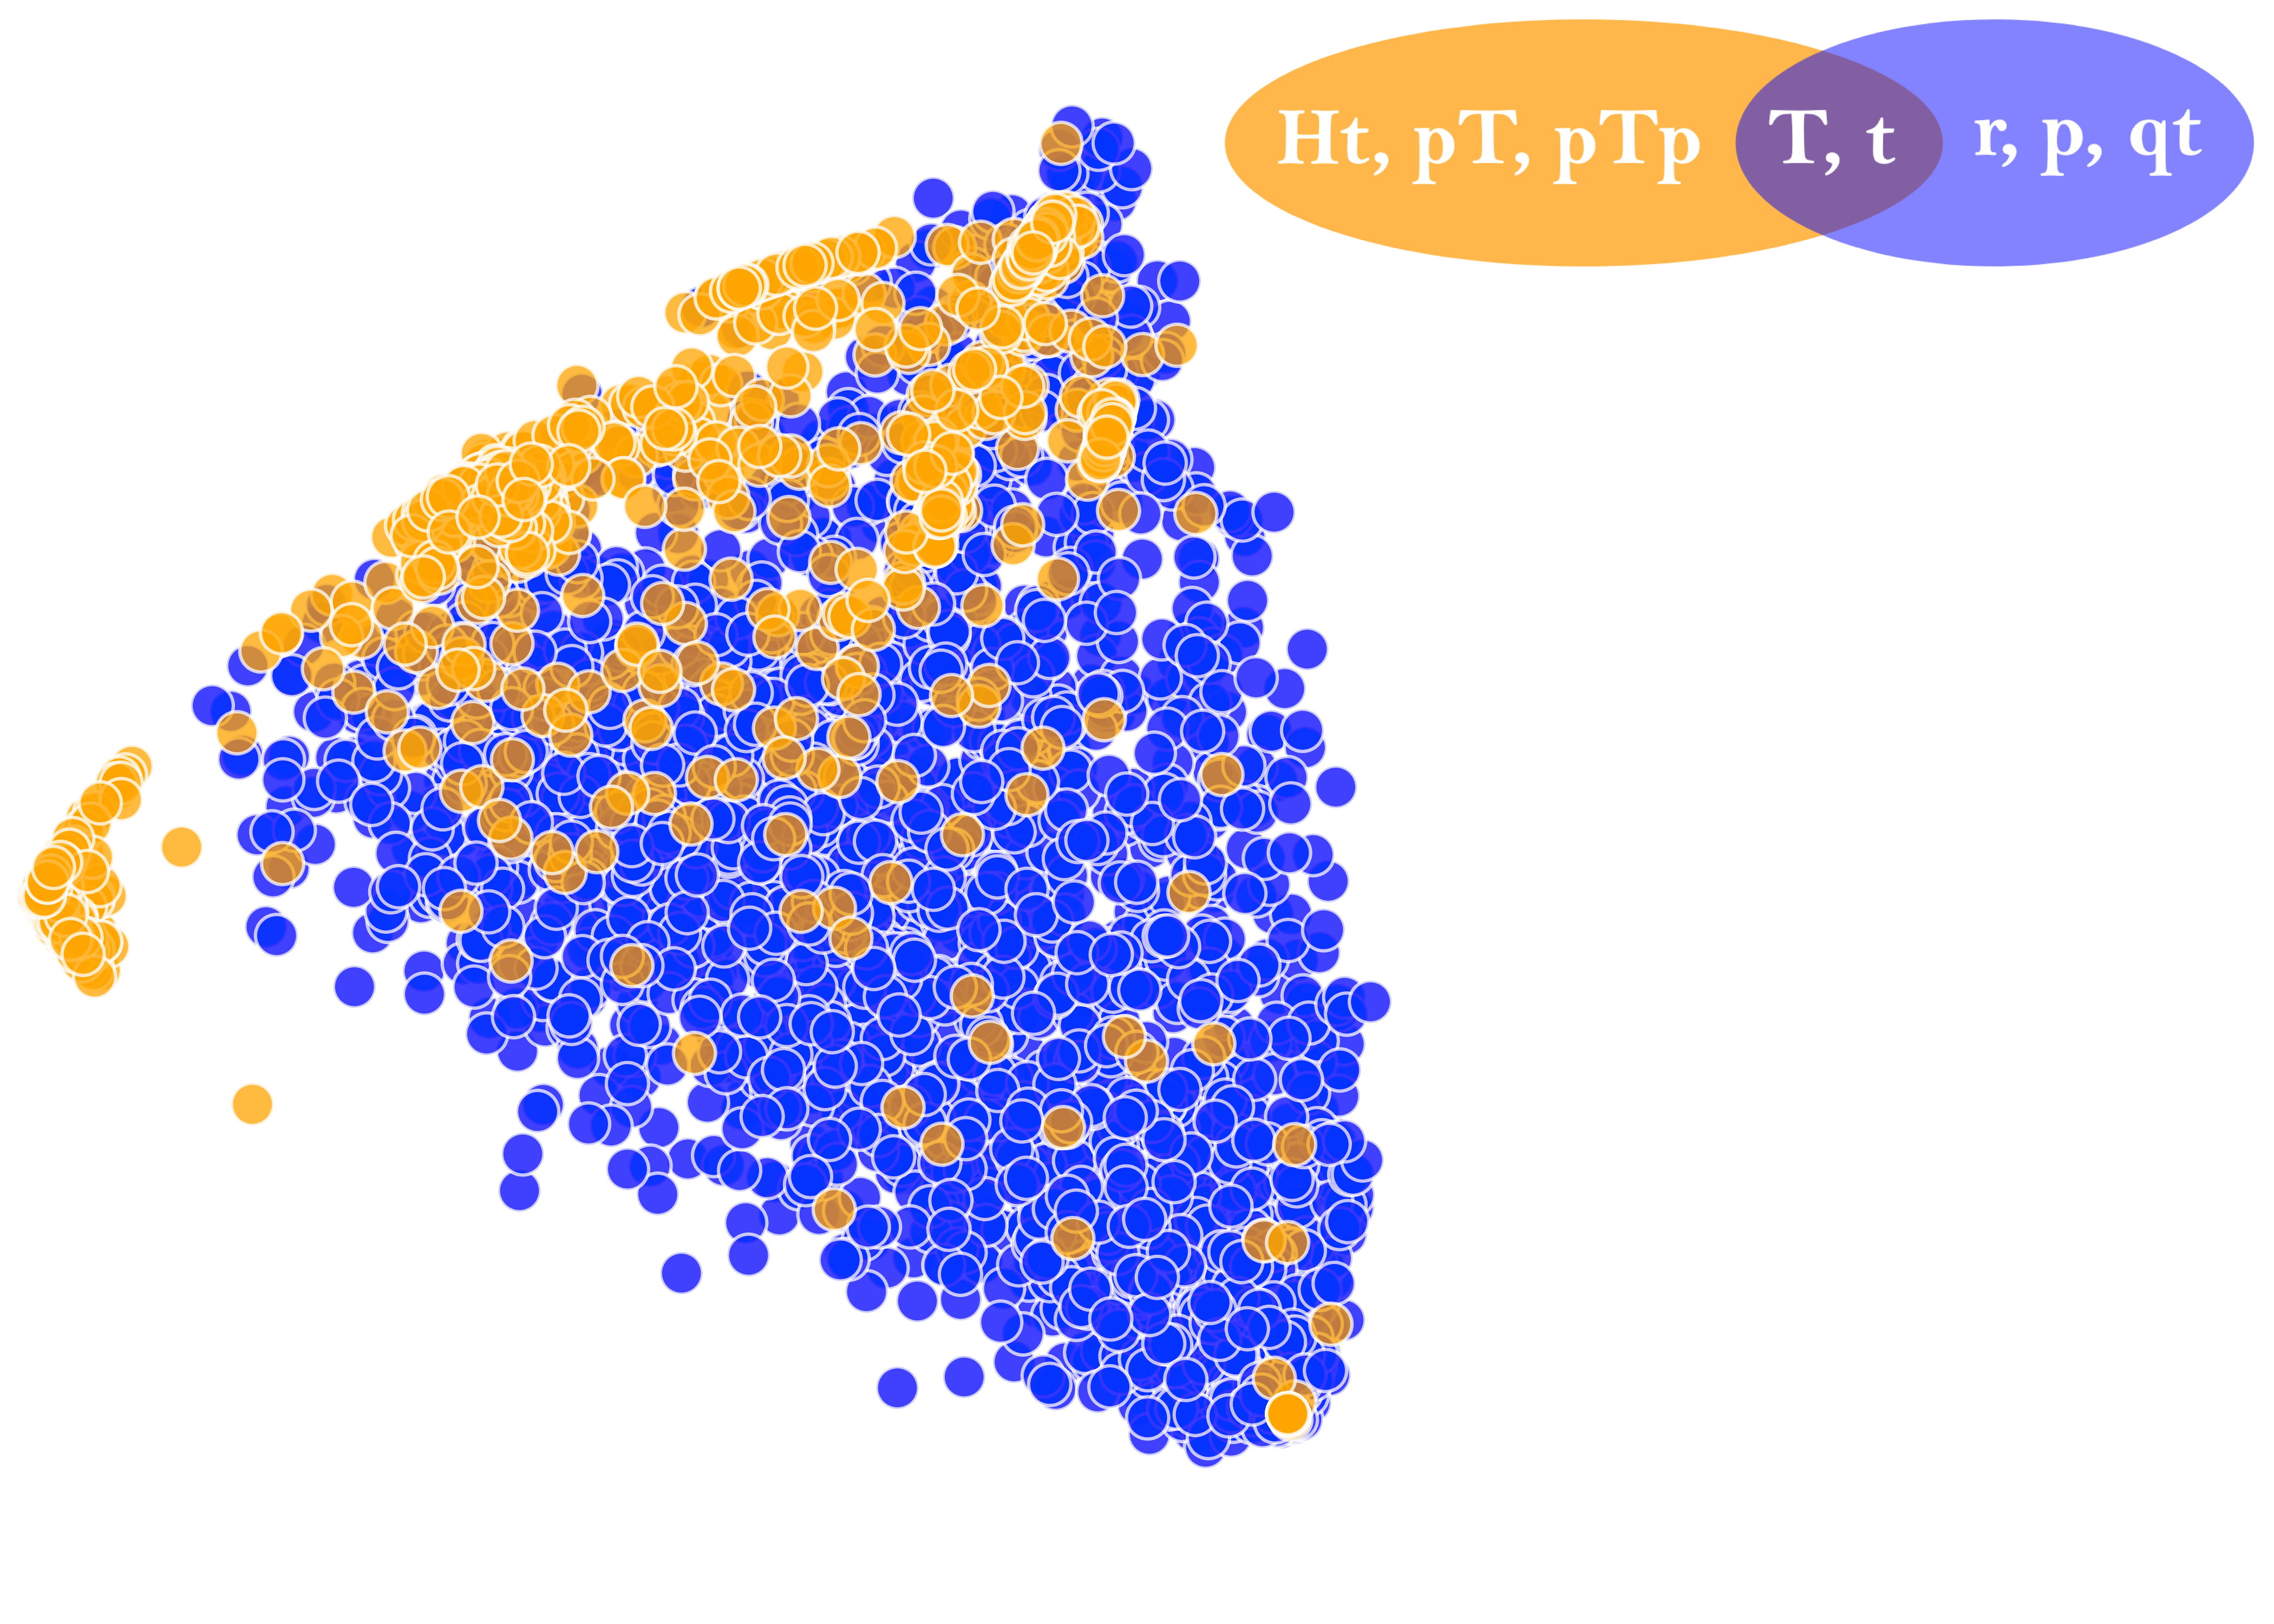
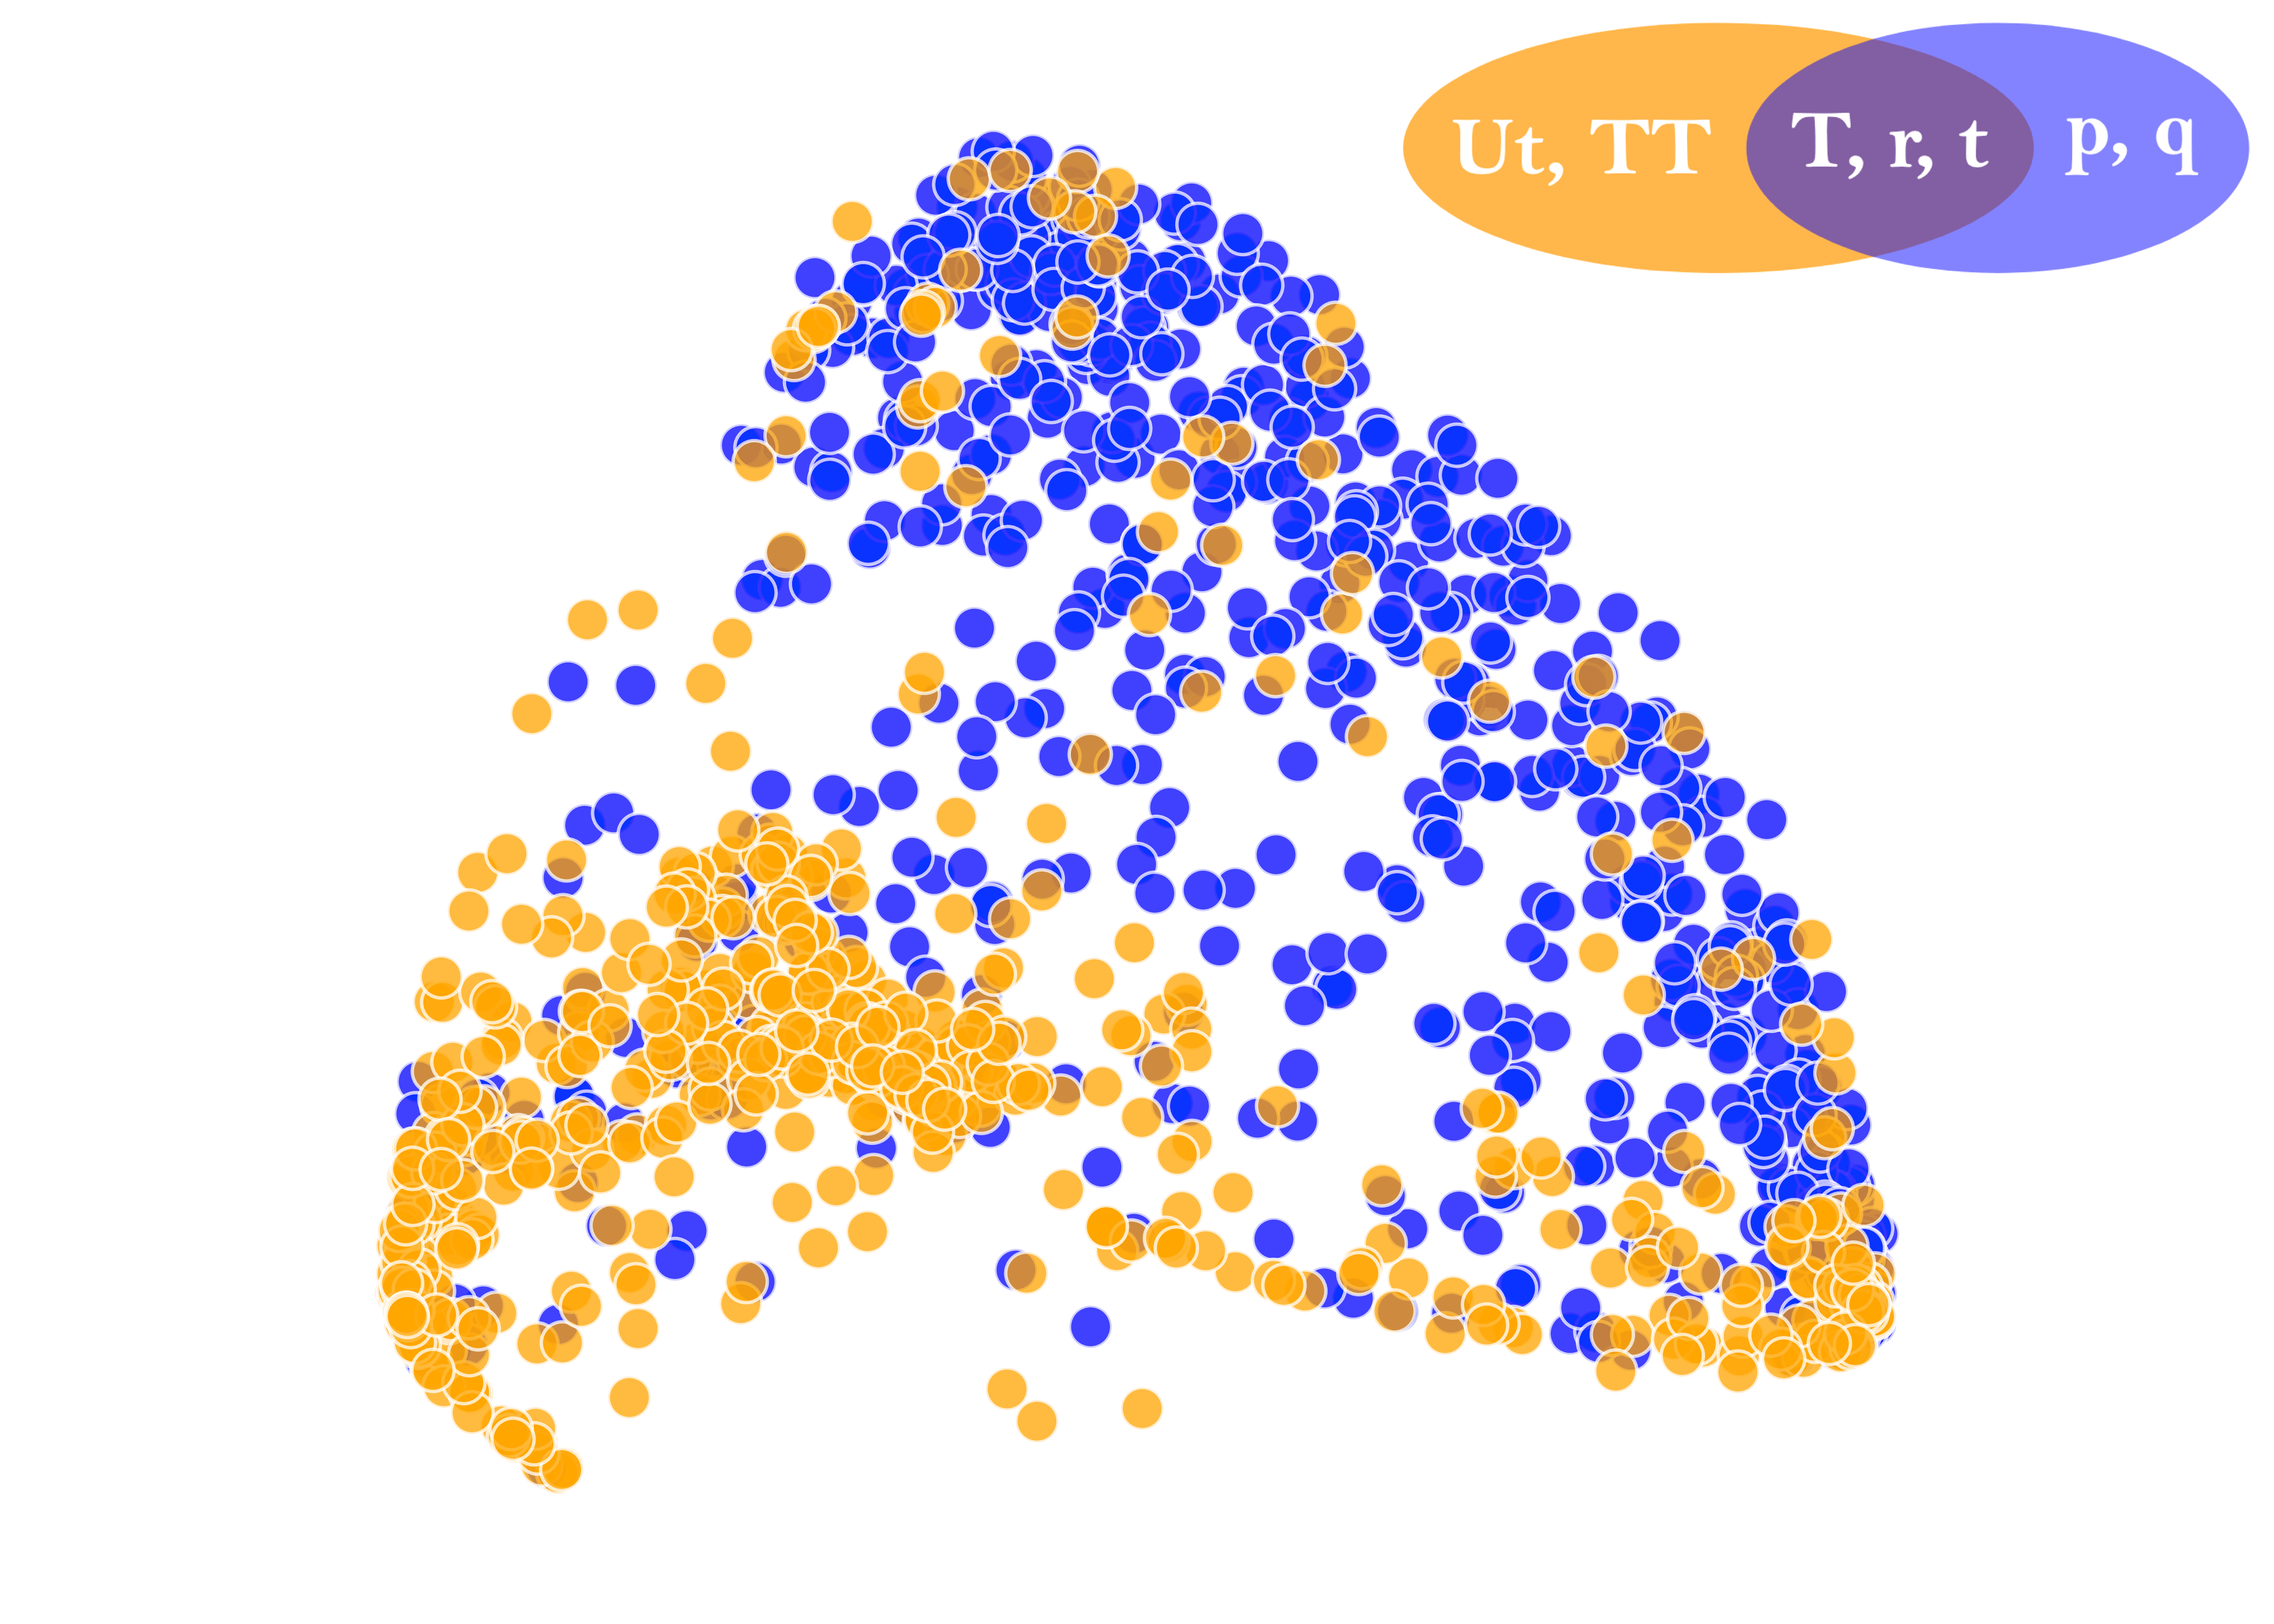
2D PCA projections of BLOC TF-IDF vectors of accounts from three datasets that include both humans (blue) and bots (orange) illustrating the discriminative power of BLOC in separating accounts of different classes: (left) cresci-17 and (right) varol-17. The Venn diagrams show the top five pause-delimited BLOC words for the bot and human accounts shown.
StoryGraph
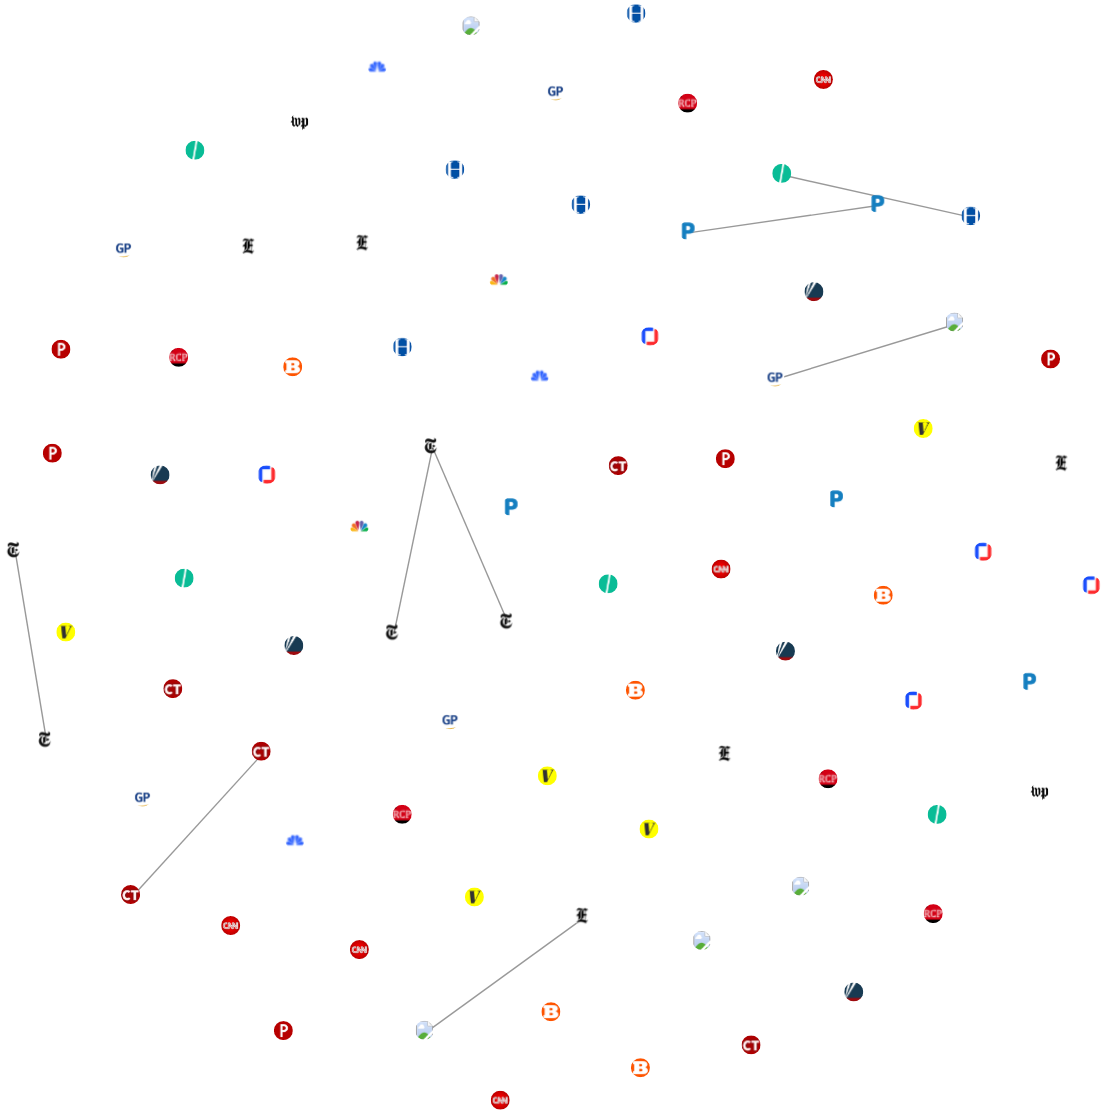
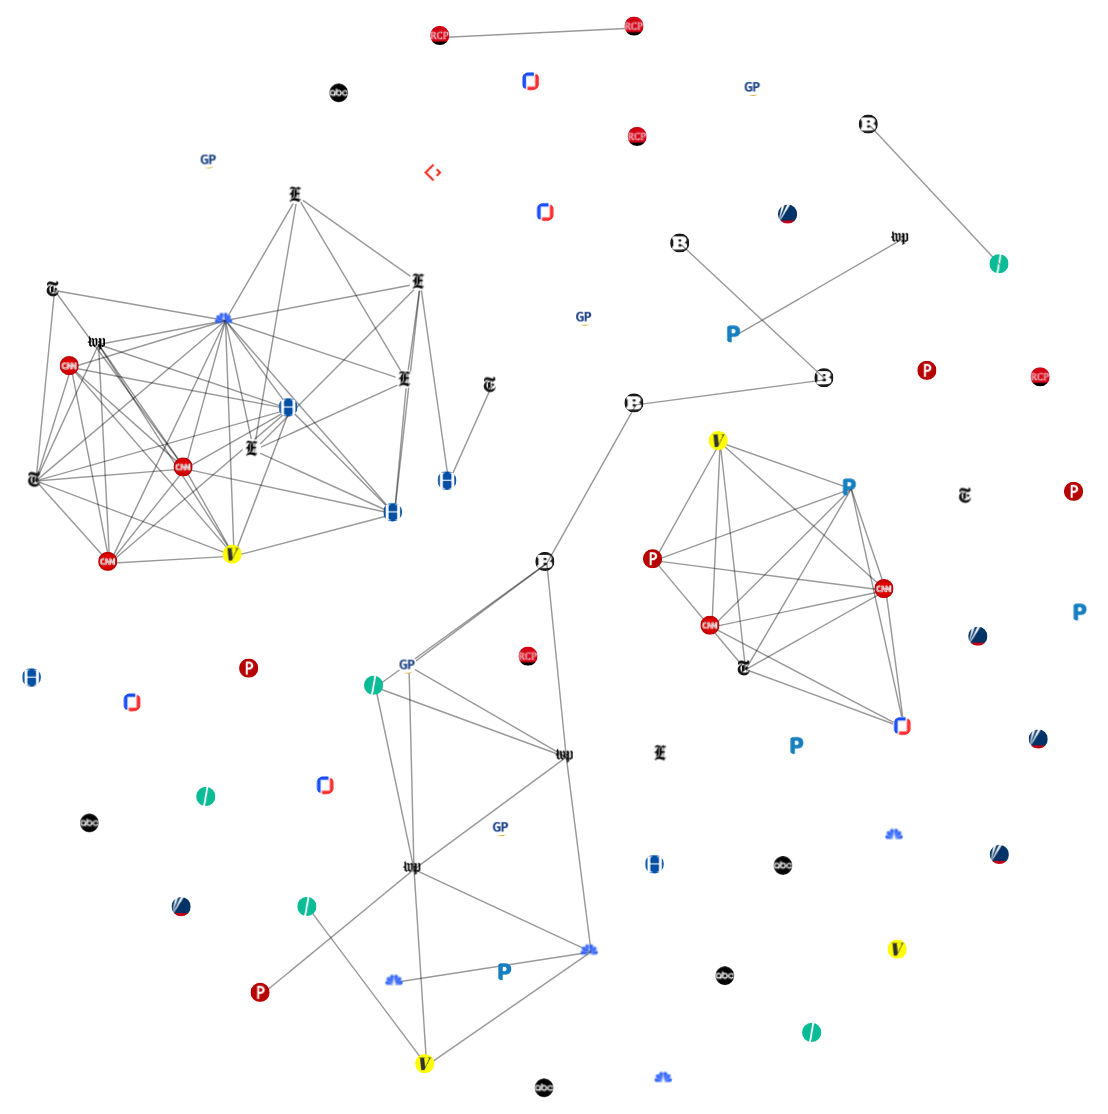
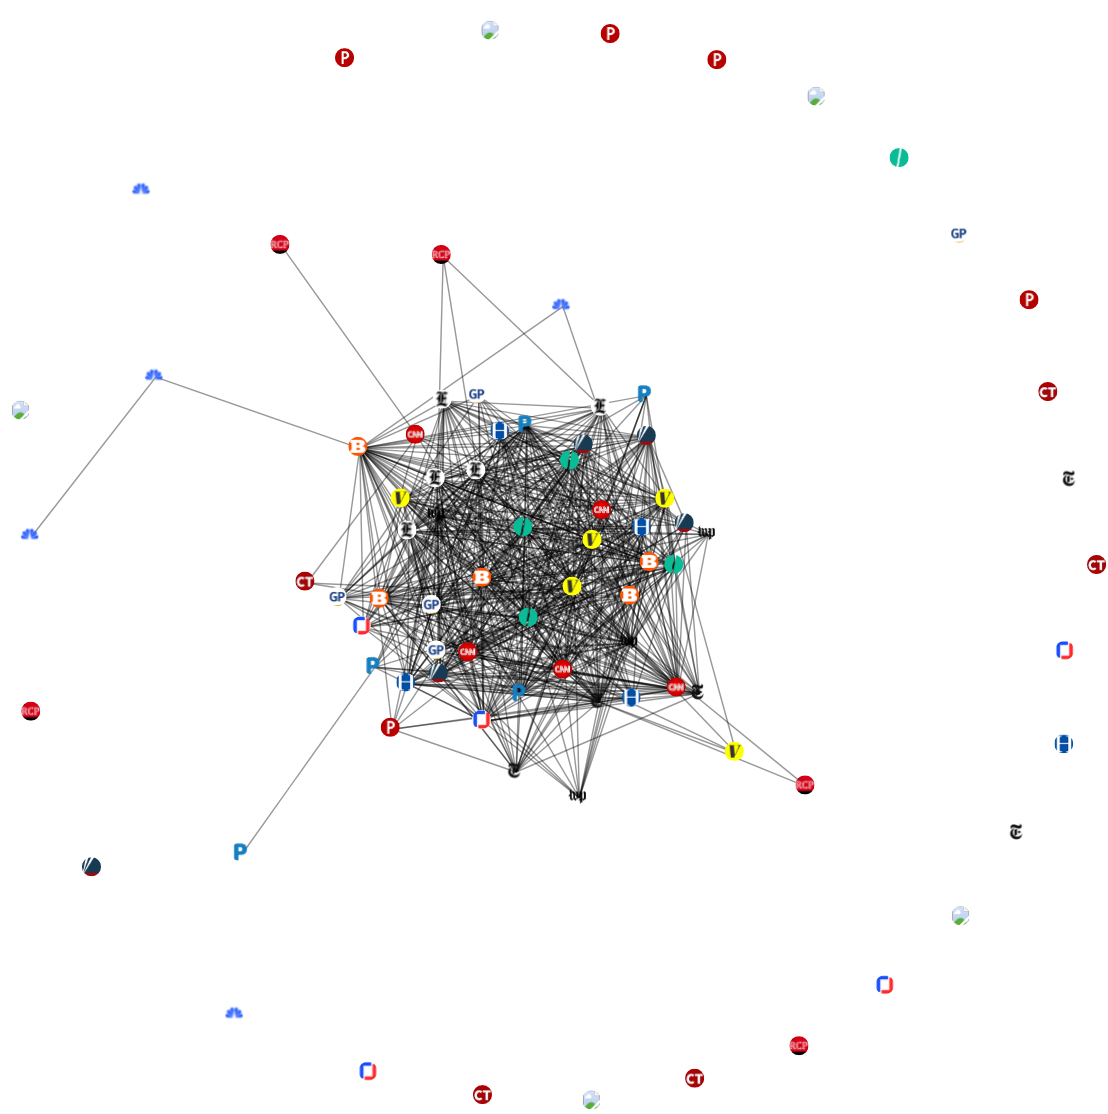
StoryGraph provides a collection of tools that analyze the news cycle. USA generates a news similarity graph every 10 minutes by computing the similarity of news stories from 17 US news sources across the partisanship spectrum (left, center, and right). In these graphs, the nodes represent news articles, and an edge between a pair of nodes represents a high degree of similarity between the nodes (similar news stories).
Three news similarity graphs illustrating the dynamics of the news cycle. In these graphs, a single node represents a news article, a connected component (multiple connected nodes) represents a single news story reported by the connected nodes. StoryGraph uses the average degree of the connected components to quantify the level of attention stories receive. The first graph shows what is often referred to as a slow news day; low overlap across different news media organizations. The second graph shows a scenario where the attention of the media is split across multiple news stories. The third graph, which is about the release of the [Mueller Report](https://en.wikipedia.org/wiki/Mueller_report), shows a major news event; high degree of overlap/connectivity across different news media organizations.
Story Attention Dynamics chart illustrating the life-cycle of two top news stories from May 18, 2018 -- May 19, 2018. Each line (red or blue) represents a top news story. The x-axis represents time while the y-axis represents the average degree of Connected Components (representation of story). Within our window of observation, the Santa Fe High School Shooting story received peak attention on Friday May 18, 2018 at 4:40PM, this attention waned with the lowest point coinciding with the rise of a new story, the Royal Wedding of Prince Harry and Meghan Markle.
Local Memory Project
Local Memory Project helps users and small communities discover, collect, build, archive, and share collections of stories for important local events from local sources.
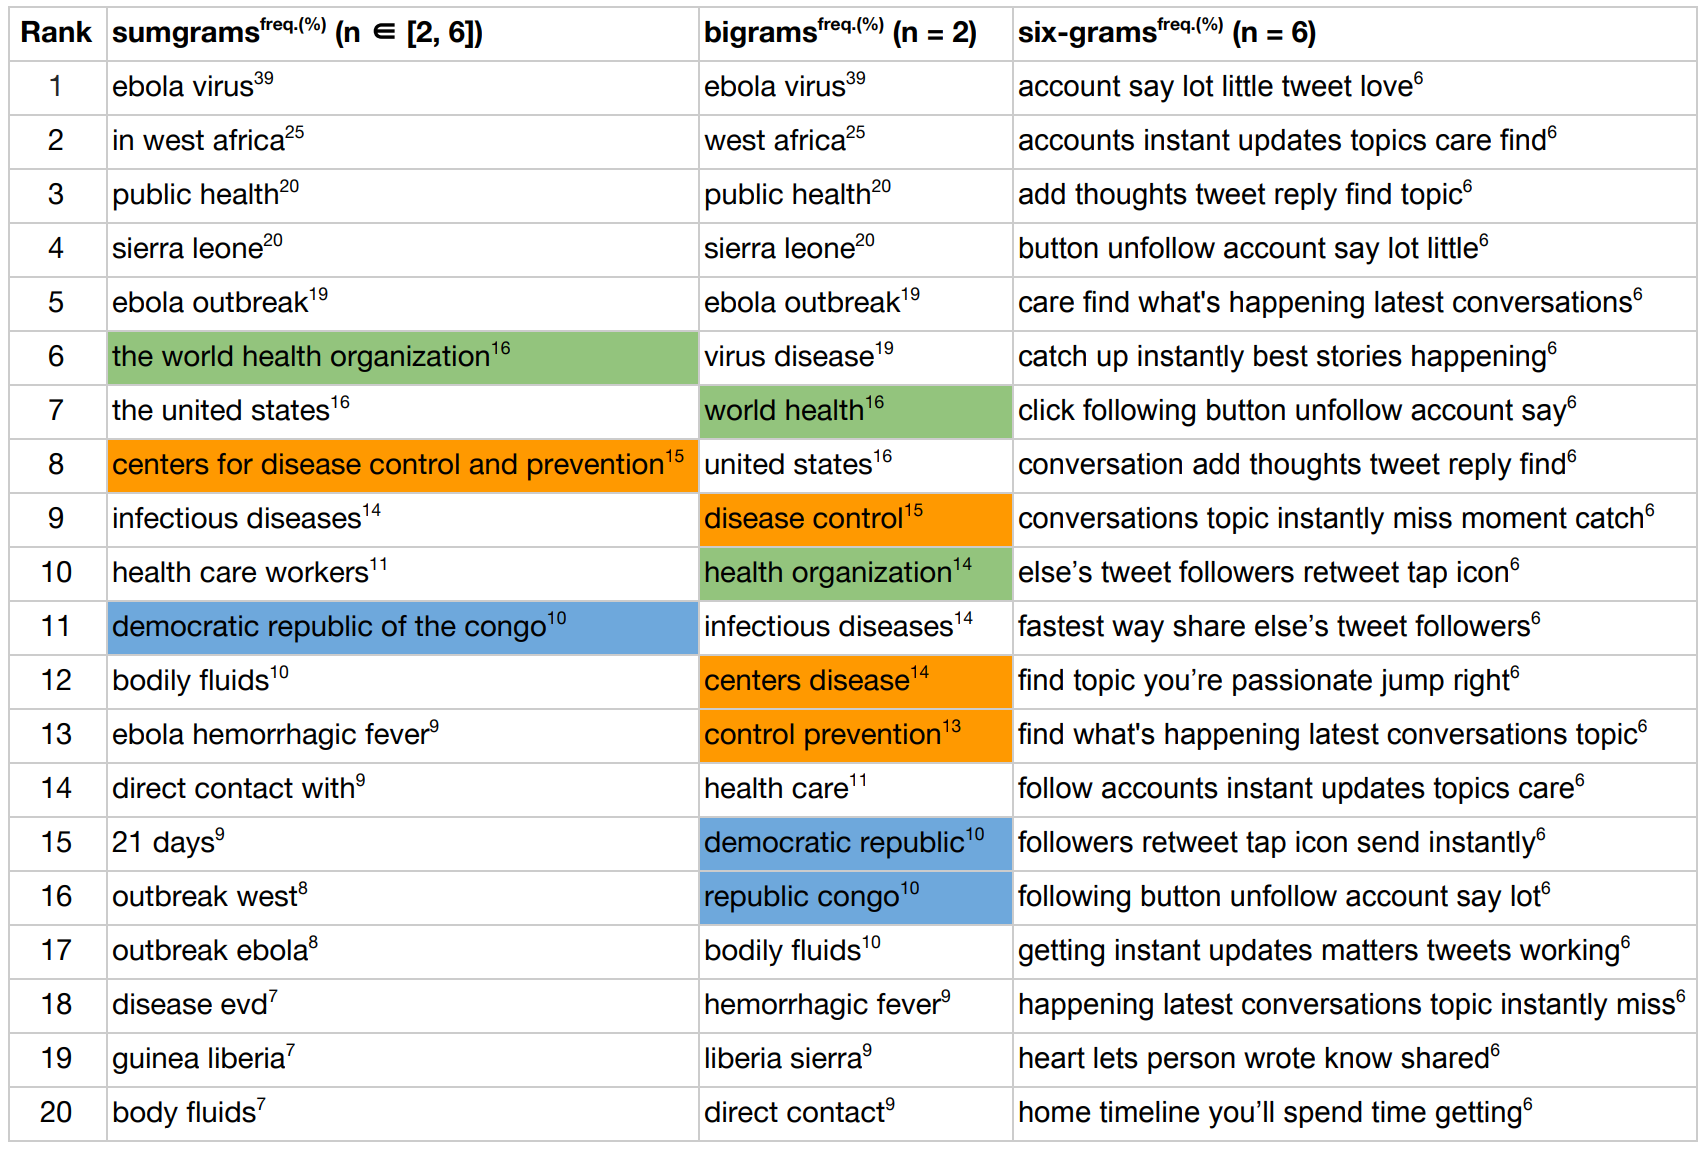
Comparison of top 20 (first column) bigrams, top 20 (second column) six-grams, and top 20 (third column) sumgrams (conjoined ngrams) generated by sumgram for a collection of documents about the 2014 Ebola Virus Outbreak. Proper nouns of more than two words (e.g., "centers for disease control and prevention") are split when generating bigrams, sumgram strives to remedy this. Generating six-grams surfaces non-salient six-
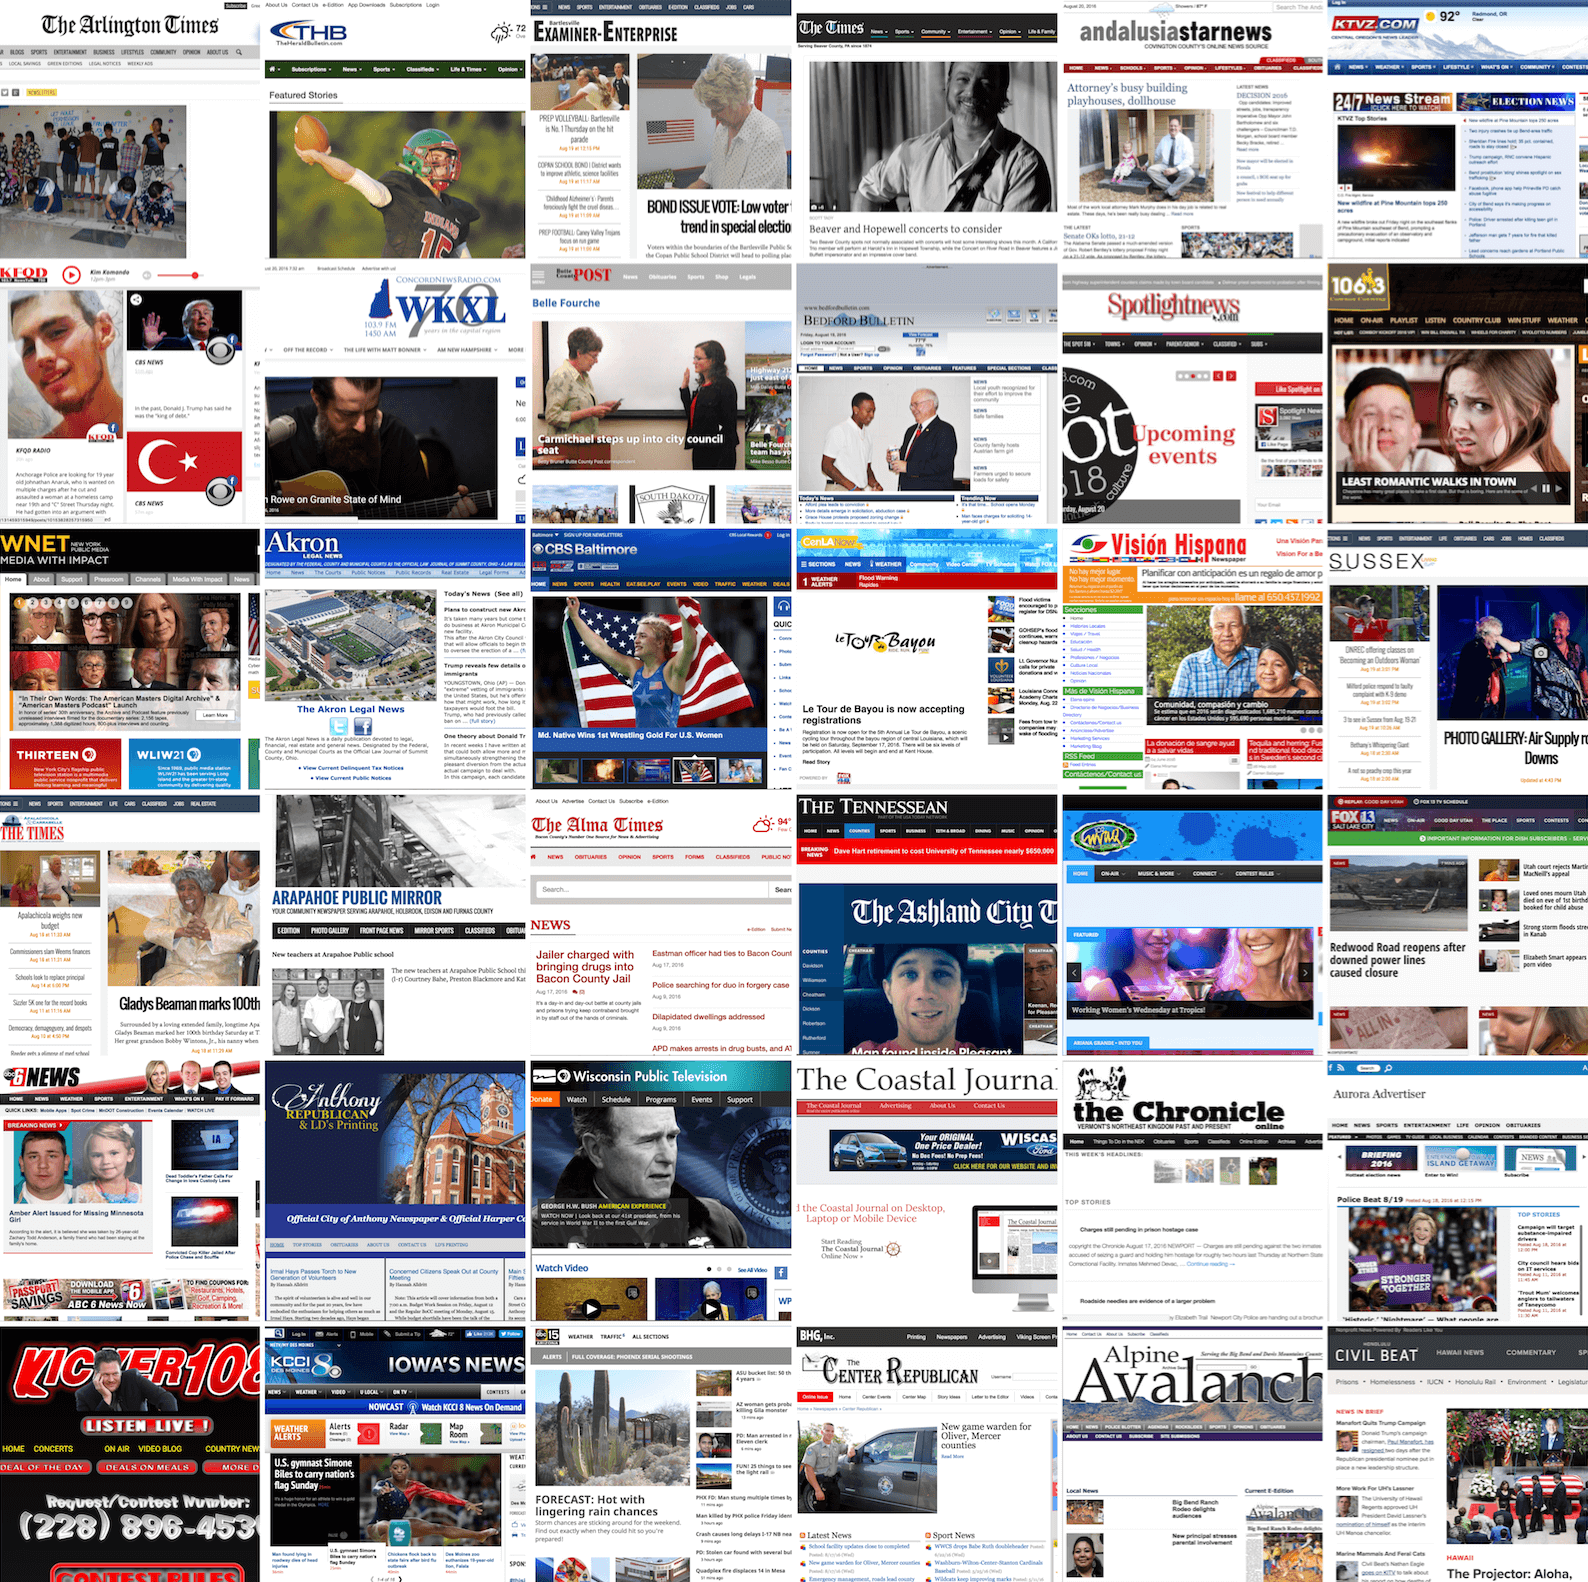
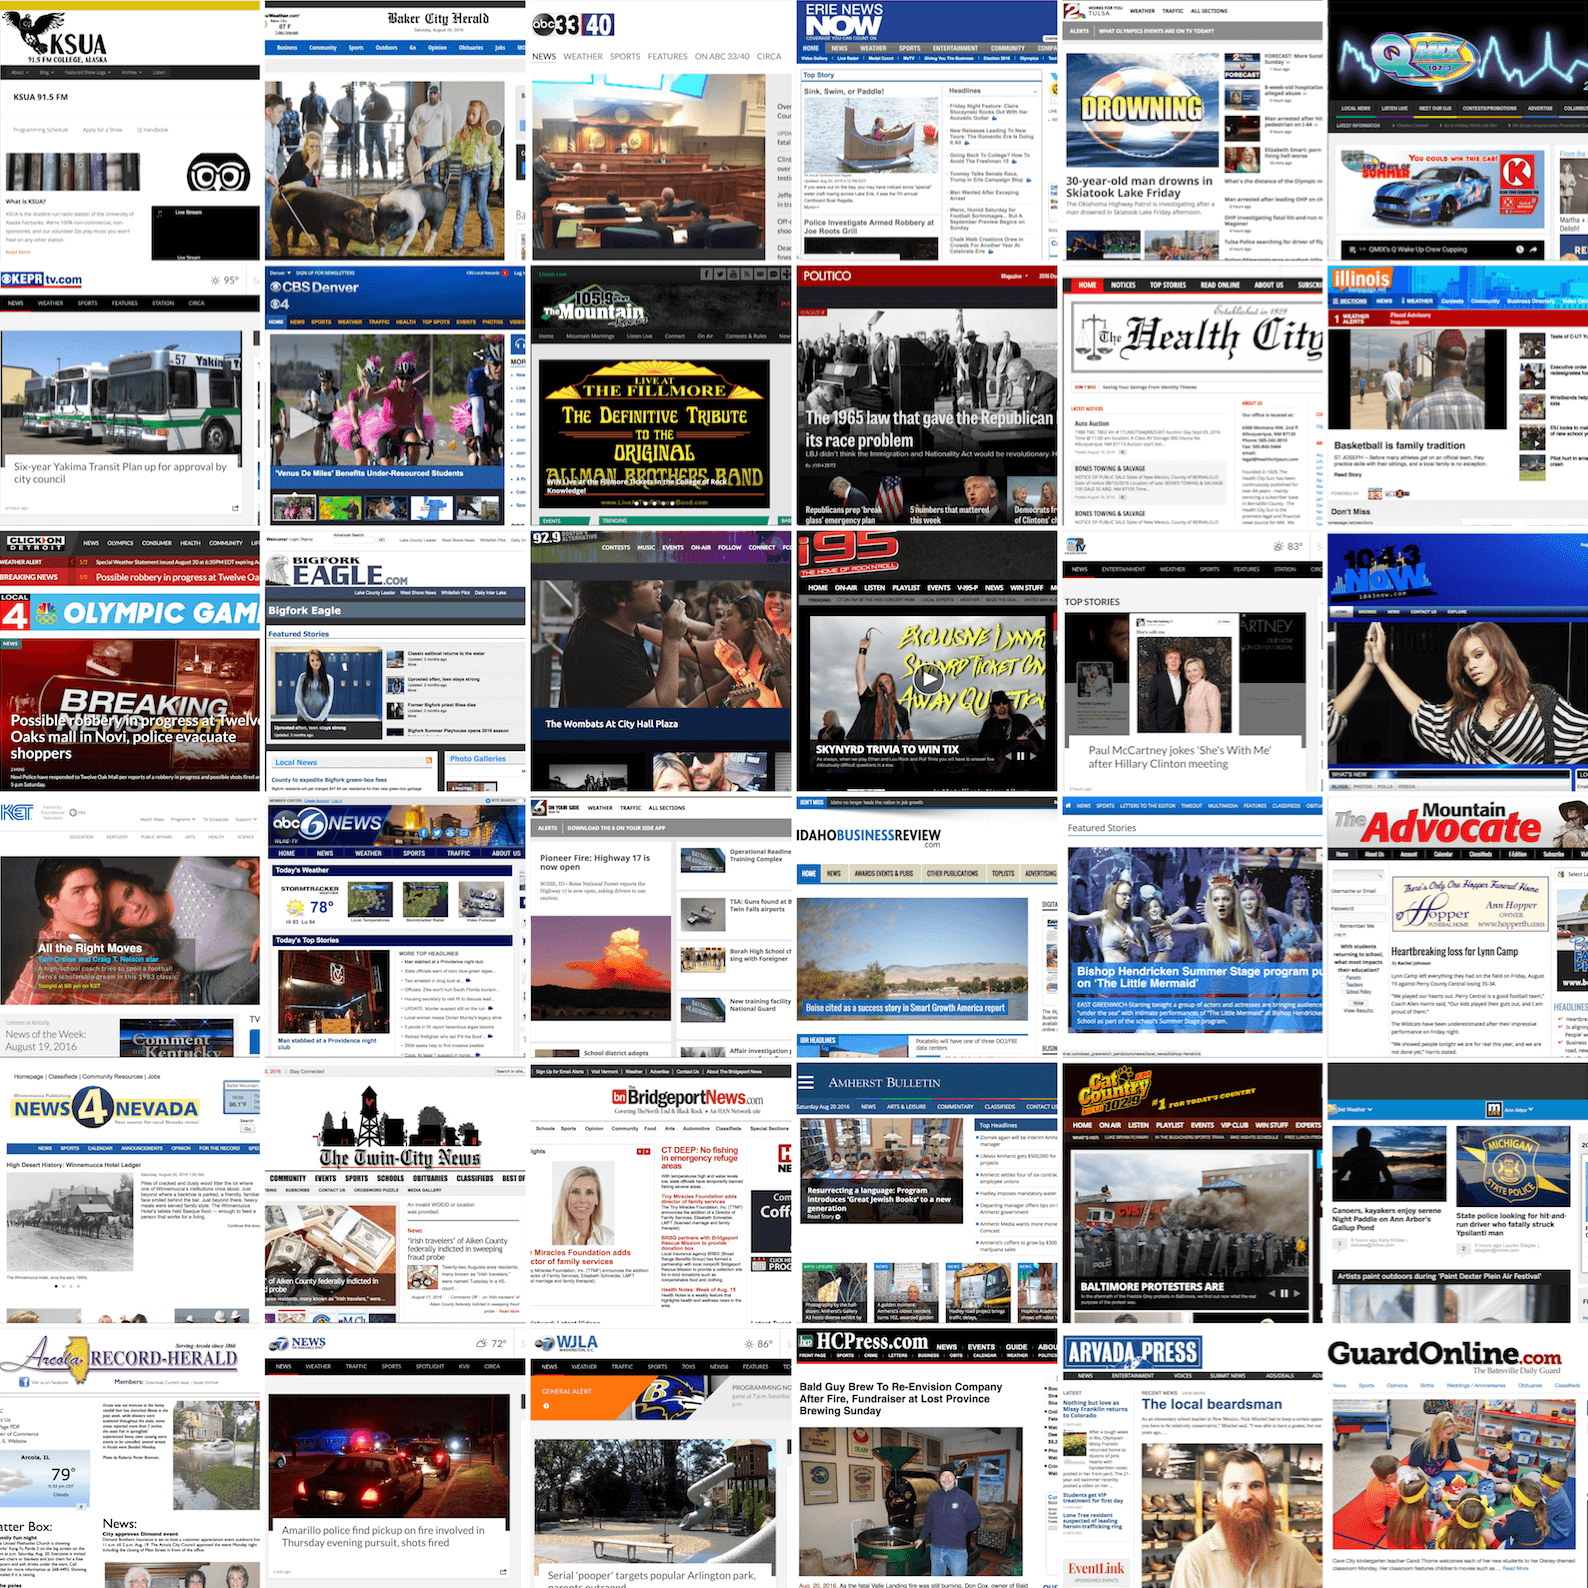
What Did It Look Like
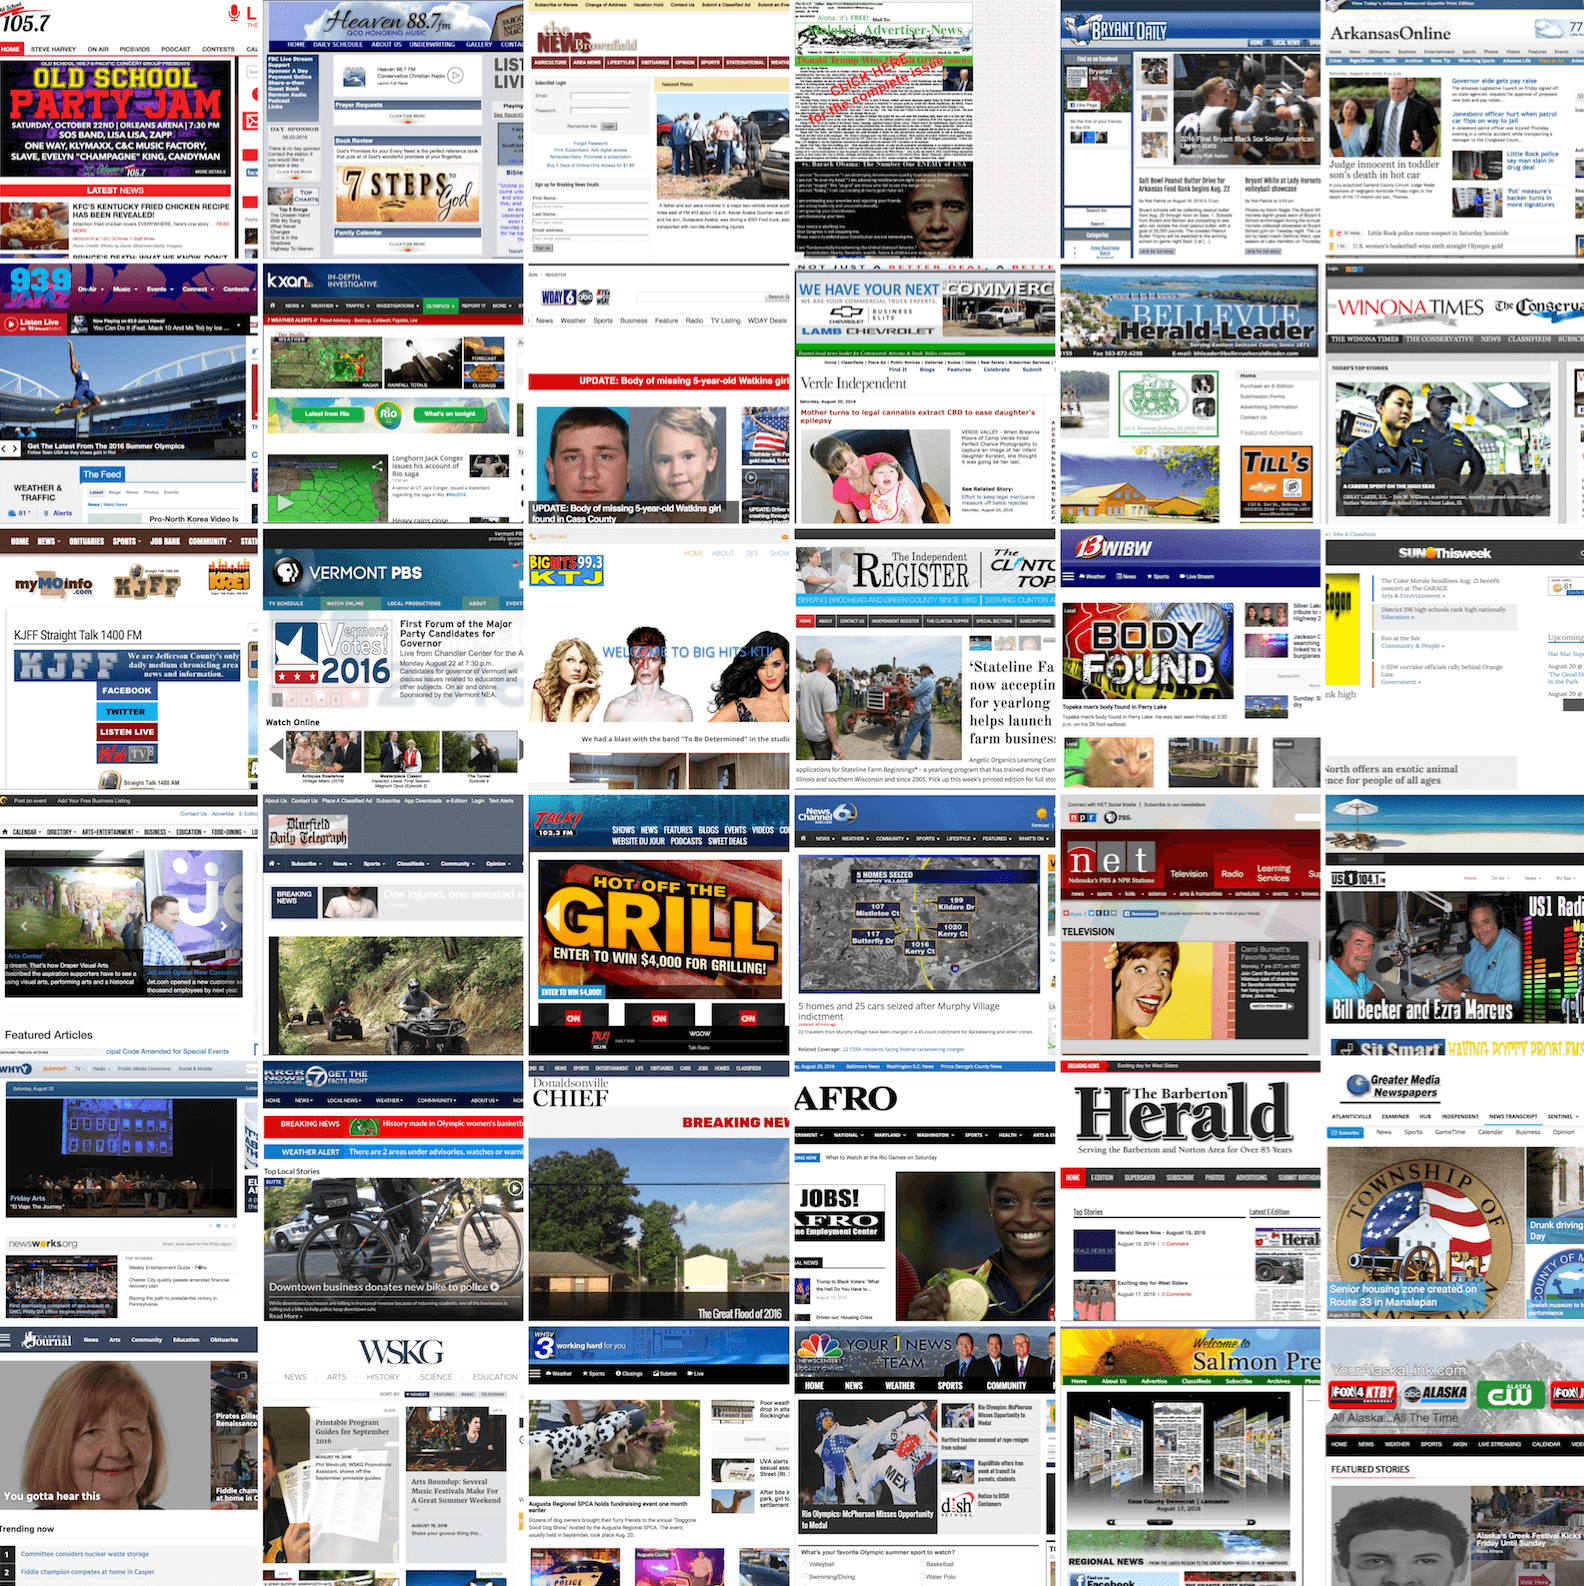
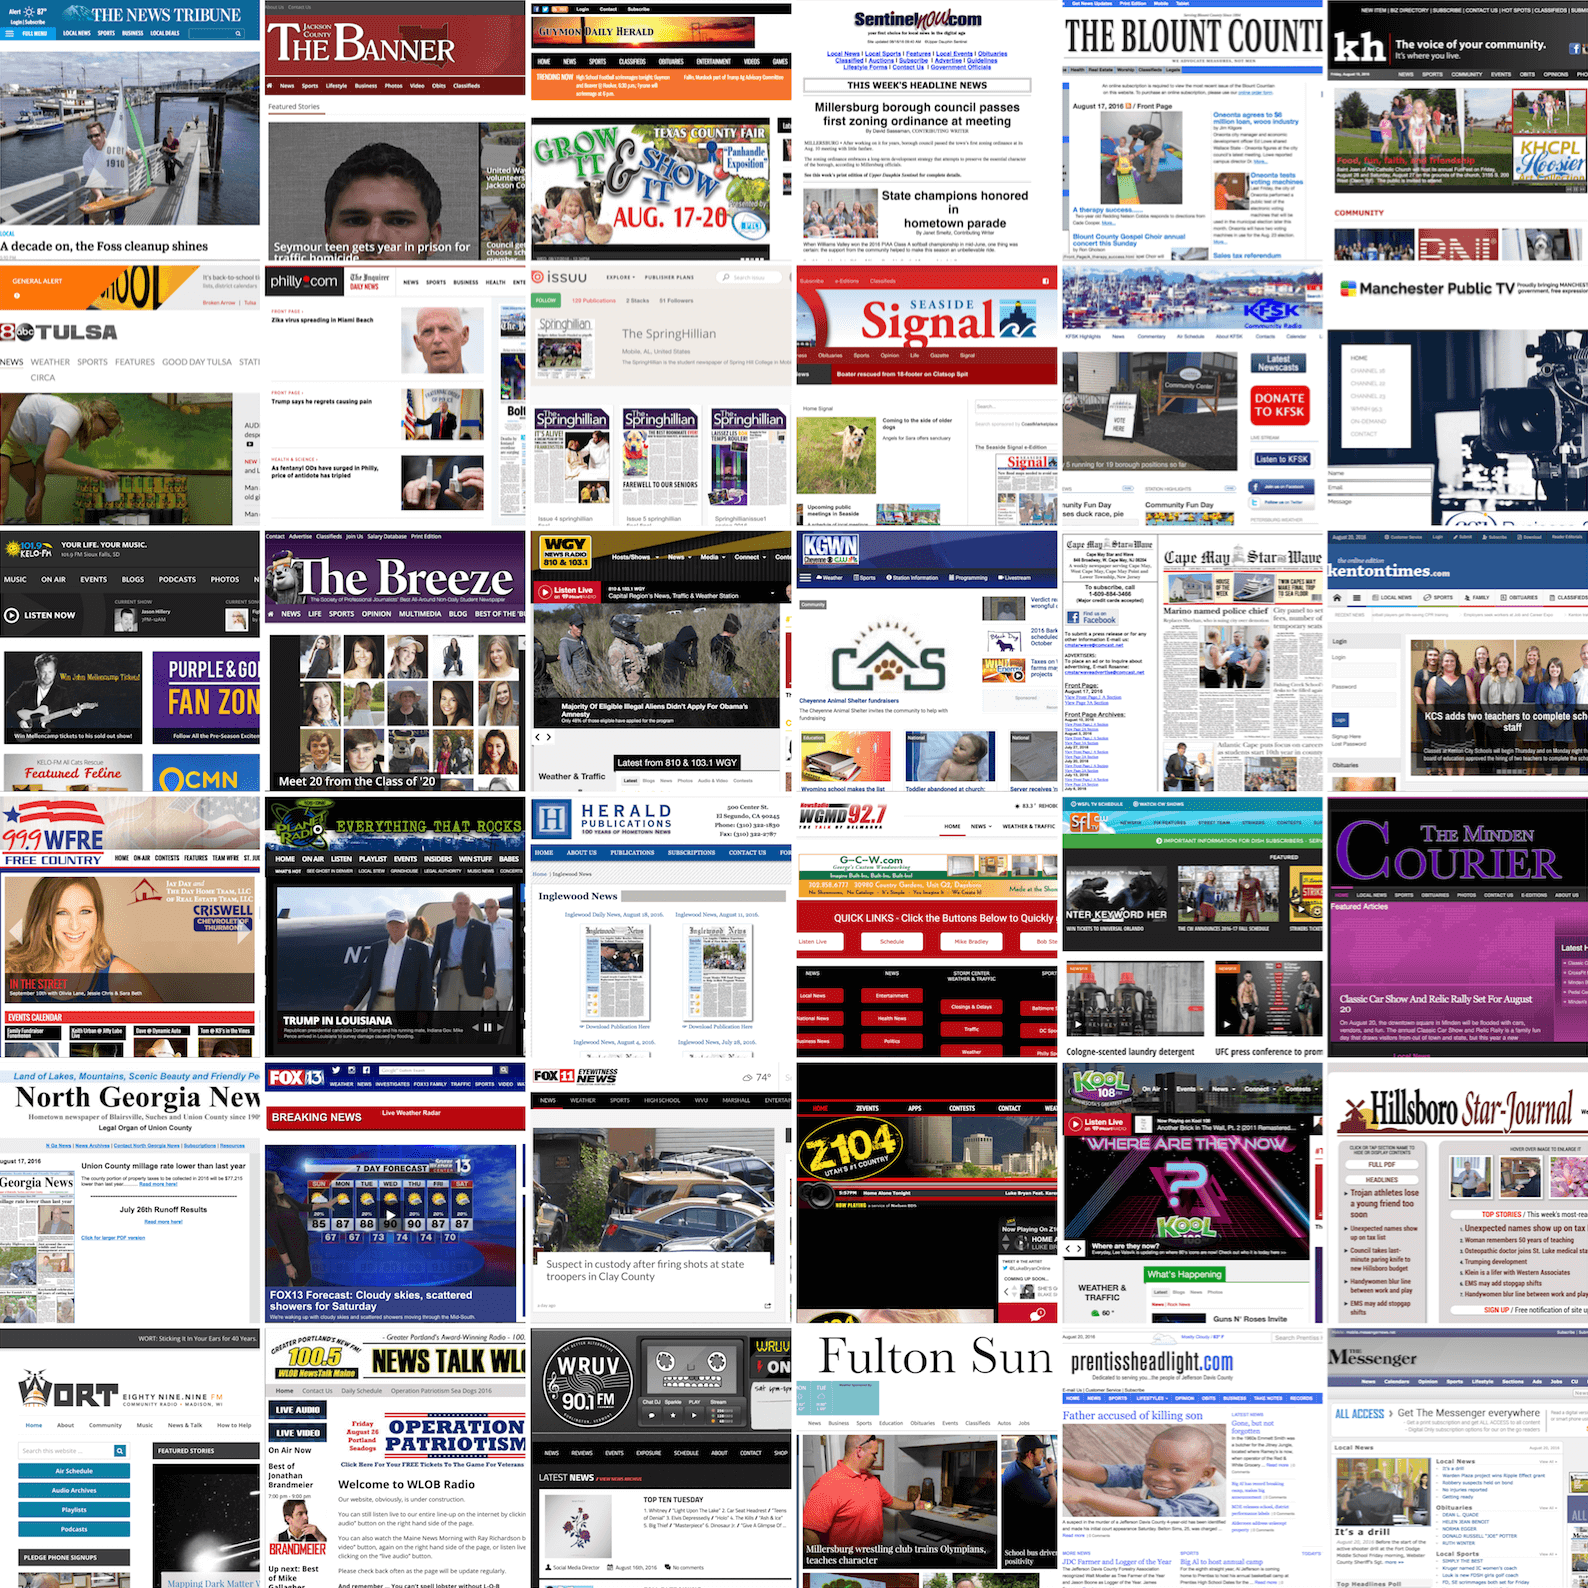
What Did It Look Like is a Twitter bot that replies to a tweet that contains the #whatdiditlooklike hashtag and a URL, with a Tumblr post of the yearly snapshot of what the webpage looked like.